Question Detail
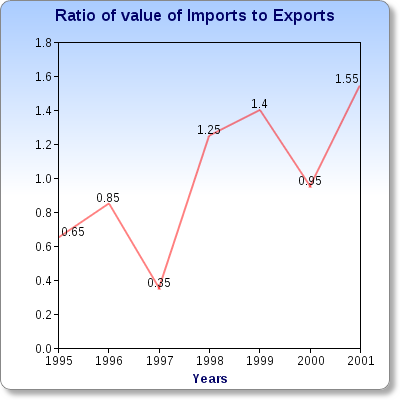
The following Line chart gives the ratio of the amounts of imports by a Company to the amount of exports from that Company over the period from 1995 to 2001. Answer the following questions based on following Line graph.

What was the percentage increase in imports from 1997 to 1998 ?
- 70
- 72
- 74
- Data Inadequate
Answer: Option D
Explanation:
For calculating the percentage we will need value of exports, imports etc. We are only given with the ratio. So data in Inadequate.
Note: Please note in charts questions, most probably it includes 1 or more than 1 questions which are percentage based. So please clear percentage questions before preparing it. Because this is very scoring section.


