- Home
- Quantitative
- English
- Reasoning
- IT Officer
- Programming
-
Computer
- Computer Awareness Questions Answers - Set 1
- Computer Awareness Questions Answers - Set 2
- Important Abbreviations Computer Awareness Questions Answers
- Important File Extensions Questions Answers
- Computer System Architecture Questions Answers
- MS Office Questions Answers
- MS Excel Questions Answers
- MS PowerPoint Questions Answers
-
GK
- Geography Questions Answers
- Indian History Questions Answers
- World History Questions Answers
- Indian Economy Questions Answers
- Indian Polity and Constitution
- Physics Questions Answers
- Chemistry Questions Answers
- Biology Questions Answers
- First In India
- First In World
- Longest and Largest
- Books and Authors
- Important Days of year
- Countries and Capitals
- Inventions and Inventors
-
Current Affairs
- Current Affairs
- Current Affairs 2018
- Current Affairs 2018 - 2019 PDF
- Current Affairs August 2019
- Current Affairs July 2019
- Current Affairs June 2019
- Current Affairs May 2019
- Current Affairs April 2019
- Current Affairs March 2019
- Current Affairs February 2019
- Current Affairs January 2019
- Current Affairs December 2018
- Current Affairs November 2018
- Current Affairs October 2018
- Current Affairs September 2018
- Govt Jobs
- Exams
- Online Quiz
- You are here
- Home
- Quantitative Aptitude
- Data Interpretation Questions Answers
- Bar Charts Questions Answers
- Aptitude Question
- Current Affairs 2019
- Current Affairs 2018
- Current Affairs December 2018
- Current Affairs November 2018
- Current Affairs October 2018
- Current Affairs September 2018
- Current Affairs August 2018
- Current Affairs July 2018
- Current Affairs June 2018
- Current Affairs May 2018
- Current Affairs April 2018
- Current Affairs March 2018
- Current Affairs February 2018
- Current Affairs January 2018
- Current Affairs 2018
- Current Affairs PDF
- Current Affairs PDF Download
- Current Affairs July 2019 PDF
- Current Affairs June 2019 PDF
- Current Affairs May 2019 PDF
- Current Affairs April 2019 PDF
- Current Affairs March 2019 PDF
- Current Affairs February 2019 PDF
- Current Affairs January 2019 PDF
- Current Affairs December 2018 PDF
- Current Affairs November 2018 PDF
- Current Affairs October 2018 PDF
- Current Affairs September 2018 PDF
- Current Affairs August 2018 PDF
- Current Affairs July 2018 PDF
- Current Affairs June 2018 PDF
- Current Affairs May 2018 PDF
- Current Affairs April 2018 PDF
- Current Affairs March 2018 PDF
- Current Affairs February 2018 PDF
- Current Affairs January 2018 PDF
Question Detail
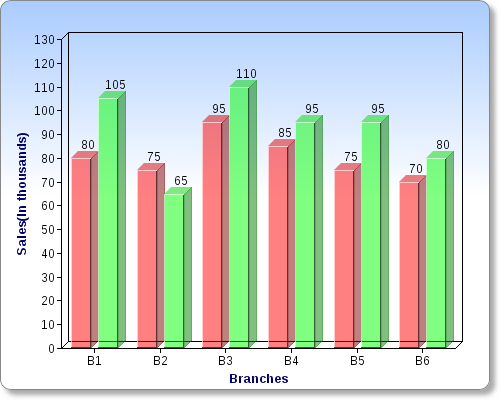
The bar graph provided below gives the sales of books (in thousand numbers) from six branches of a publishing company during two consecutive years 200 and 2001. Answer the questions based on the graph.

Total sales of the branches B1, B3 and B5 together for both the years (in thousand numbers) is :
- 550
- 560
- 570
- 580
Answer: Option B
Explanation:
Total sales of branches B1, B2 and B5 for both the years (in thousand numbers is)= (80+105)+(95+110)+(75+95)
= 560
Thanks ! Your comment will be approved shortly !
- Copyright 2014 - All rights reserved
- Terms Of Use & Privacy Policy
- Contact Us
- Copyright


